Focus your efforts to drive business results
As a digital marketer, you are always looking for ways to optimize your Paid Media campaigns and improve your results. What digital marketer doesn’t want to deliver the highest possible returns for their company or their clients? If you can show that digital marketing efforts are driving tangible business results, you'll be much more likely to get recognition (and budget) for your work.
But with so many different potential optimizations out there, it can be tough to know which ones are worth pursuing. The sheer volume of campaign assets to be managed can be overwhelming. A commonly-heard complaint among digital marketers is that execution and reporting pressures leave little time to be strategic.
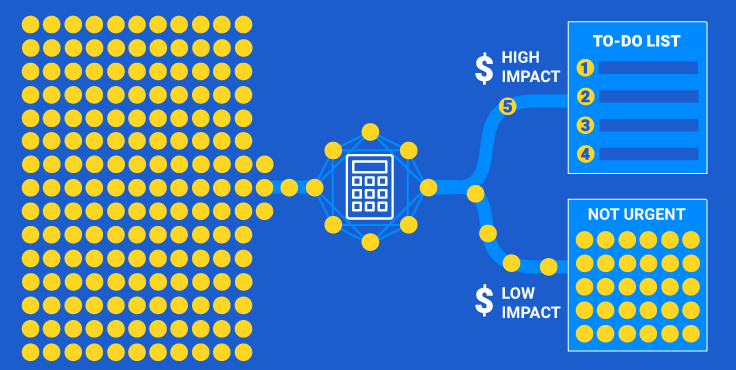
Digital marketers are under increasing pressure to show the financial impact of their work. In response, they are turning to data-driven methods to prioritize their activities. A great way to prioritize optimization tasks is based on likely improvement to top-line business results of each candidate task. We all have the best intentions, but it isn’t humanly possible to optimize every keyword, ad copy, and landing page every week. Determining which optimization tasks will have the greatest positive impact on Revenue and ROAS (or Leads and CPA) can transform your effectiveness as a digital marketer.
Some optimizations will lead to marginal improvements, while others will have a significant impact on the bottom line. The problem is, you can’t always tell the difference by looking at a snapshot of performance metrics. And often, the best opportunities are buried deep within the campaign hierarchy. So how can you know which assets you should work to improve?
We offer this 6-step process for prioritizing your PPC optimizations, so you can gain the maximum financial impact for your advertising efforts.
- Goal: sort all optimization opportunities from highest to lowest potential business impact. Once you have a solid list of priorities, you’ll be able to start at the top and work your way down the list, maximizing your impact with whatever time you have available.
SPOILER ALERT! …There’s quite a bit of math involved. But setting up the calculations below will yield big rewards. (Or you can check out Condati’s Quant Marketer. It does all this work for you!) -
Judge each asset’s performance relative to its peers - Digital marketer’s instinctively judge the performance of a campaign asset by comparing its KPIs to those of similar assets - by perusing metrics inside the ad platforms or by generating reports. The key to prioritizing by financial impact is determining which underperforming assets will produce the biggest increases in revenue or leads if you can get their funnel metrics on par with their peers. These are the diamonds in the rough. What are the asset’s “peers,” you ask? Peers are assets at the same level of campaign hierarchy and within the same or similar campaigns, e.g., all the keywords in your non-brand purchase campaigns targeting Europe. Peer group (also known as cohort) performance benchmarks will help you understand how much improvement in a given metric you can reasonably expect to achieve. Start by organizing your campaigns into Campaign Groups, campaigns in the same Family (region, product category, etc.), with the same Objective (Awareness, Traffic, Lead Generation, Purchase), and the same Brand/Non-Brand designation. Campaigns in the same Campaign Group should have a common ROAS or CPA target (or CPC for Traffic).
- Establish benchmarks for CTR, Conversion Rate, and ROAS (or CPA). The next step is to set attainable goals for improving the funnel metrics of specific campaign assets. For this, we can look to peers at the same level of hierarchy and within the same Campaign Group (we call this a cohort). Resist the urge to follow your gut instincts; do the math - statistics, in this case. For each funnel metric (CTR, Conversion Rate, and ROAS/CPA), calculate the 70th percentile of all the assets at a given level of campaign hierarchy within a campaign group. The 70th percentile represents the “passing grade” or attainable goal for each metric. Each cohort benchmark answers the question, “What improvement should I be able to achieve for this metric?” This is the key to prioritizing by potential upside.
-
Size the “Shortfall” in terms of clicks, conversions, or revenue. Look for assets that are performing below one or more of the benchmarks you calculated for Click-Through Rate (CTR), Conversion Rate, and ROAS or CPA - having been careful to form appropriate cohorts by calculating separate benchmarks for each metric, in each campaign group, and at each level of hierarchy. For those assets that fail to meet one or more benchmarks, calculate the Shortfall for the corresponding stage of the funnel. Shortfall is a term for how many more clicks, conversions, leads or revenue would have been generated if the asset had performed exactly at its cohort benchmark for CTR, Conversion Rate, or ROAS or CPA Benchmark.
Step 1:
Calculate the estimated number of clicks (Impressions x CTR Benchmark).
Step 2:
Calculate the shortfall (Estimated Clicks - Clicks).
Example: Keyword ABC in campaign group DEF has 10,000 Impressions and 210 Clicks, for a CTR of 2.1%. Let’s say the CTR Benchmark at the keyword level for campaign group DEF is 5.2%. If the keyword had performed at exactly the CTR Benchmark for its cohort, 5.2%, it would have generated 520 Clicks. Therefore, the Clicks Shortfall for Keyword ABC is 520 minus 210 or 310 Clicks. You will use Shortfall to calculate potential upside in the next step.
The example above is about CTR optimization. For Conversion Rate optimization, you will be solving for Conversions Shortfall. For ROAS optimization, you will be solving for Revenue Shortfall. In other words, how much revenue would have been created if all a keyword’s conversions had performed at the ROAS Benchmark.
-
Determine Potential Upside in Revenue or Leads. The final step is to calculate potential upside in terms of revenue or leads.
Step 1:
Calculate the actual revenue-per-click (Total Revenue / # Clicks) and revenue-per-conversion (Total Revenue / # Conversions) for each individual keyword.
Step 2:
For each keyword, multiply revenue-per-click (or conversion) times the Clicks Shortfall (or Conversions Shortfall) from above.
Step 3:
The result represents the potential upside in Revenue (or Leads).
Prioritizing your optimization tasks by potential upside will ensure that you maximize the financial impact of your PPC optimization efforts and make the most of what limited time you have available.
-
Make improvements from the bottom of the funnel to the top. Identify assets that are already meeting their ROAS or CPA benchmarks and determine where in the funnel of impressions to clicks to conversions the flow is getting stuck.
Ask yourself? To do: Is Conversion Rate below the benchmark? A/B test elements of your landing page. Is CTR below the benchmark? Try to improve your ad copy. The goal is to get more volume flowing through your highest-performing assets first, in order of upside potential. Why is it important to focus on the bottom of the funnel first? Imagine unjamming the top of the funnel, creating a tidal wave of clicks, and having those clicks generate an abundance of unprofitable transactions! This might happen if you don’t first optimize for an acceptable ROAS (or CPA) and conversion rate.
Conclusion
Prioritizing optimization work by financial impact is a core principle of state-of-the-art Performance Marketing. Successful prioritization requires a combination of digital marketing domain expertise and data analysis expertise. Condati’s Quant Marketer automates data-driven marketing decisions by encapsulating both! It ingests all your ad platform and website analytics data, computes the thousands of required benchmarks and metrics, and generates explicit directives showing the recommended optimization actions at every level of campaign hierarchy – many of which can be executed by simply bulk uploading files to the ad platforms. And finally, Quant Marketer prioritizes Paid Media content optimization tasks by financial impact! It shows you what an expert would do to maximize digital marketing performance. For more information, book a meeting now.