At conDati, we’re committed to innovation. That means our data scientists and data engineers continue to build capabilities that improve digital marketing performance. We actively listen and co-innovate with our clients and partners to make platform improvements that help you gain confidence in your marketing data, boost your productivity by 50 to 80 percent, and increase lower funnel conversions by 3 to 5x. We like knowing that we help you confidently walk into quarterly business review meetings armed with campaign performance results that are directly tied to business goals—with forecasted KPIs to help you validate every campaign spend decision.
Each “What’s New” update will highlight new features to the conDati Data Science as a Service platform. If you’d like a deeper dive into these improvements or new features, we’d love to hear from you!
Let’s get started.
NOTE: you can click on the screenshots below to see larger versions!
Data Unification
New direct data source integrations
- We’re providing ongoing data engineering to expand direct integration with data sources from the marketing technologies that our customers use
- Added first-class data source support for AdRoll, LinkedIn, HubSpot CRM, Salesforce CRM, and Amazon Ads


Robust custom data import process
Built to handle custom data sources, then load that data at the required frequency
- Imports data from systems without APIs such as spreadsheets, CSV files, or table exports
- Legacy POS systems or custom CRM systems
- “Offline” data such as TV and radio data, etc.
Actionable Intelligence
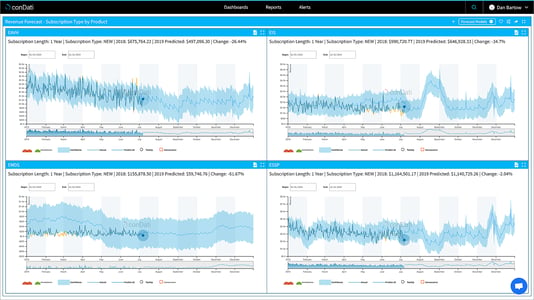
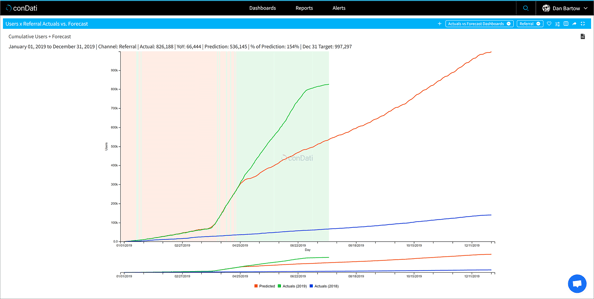
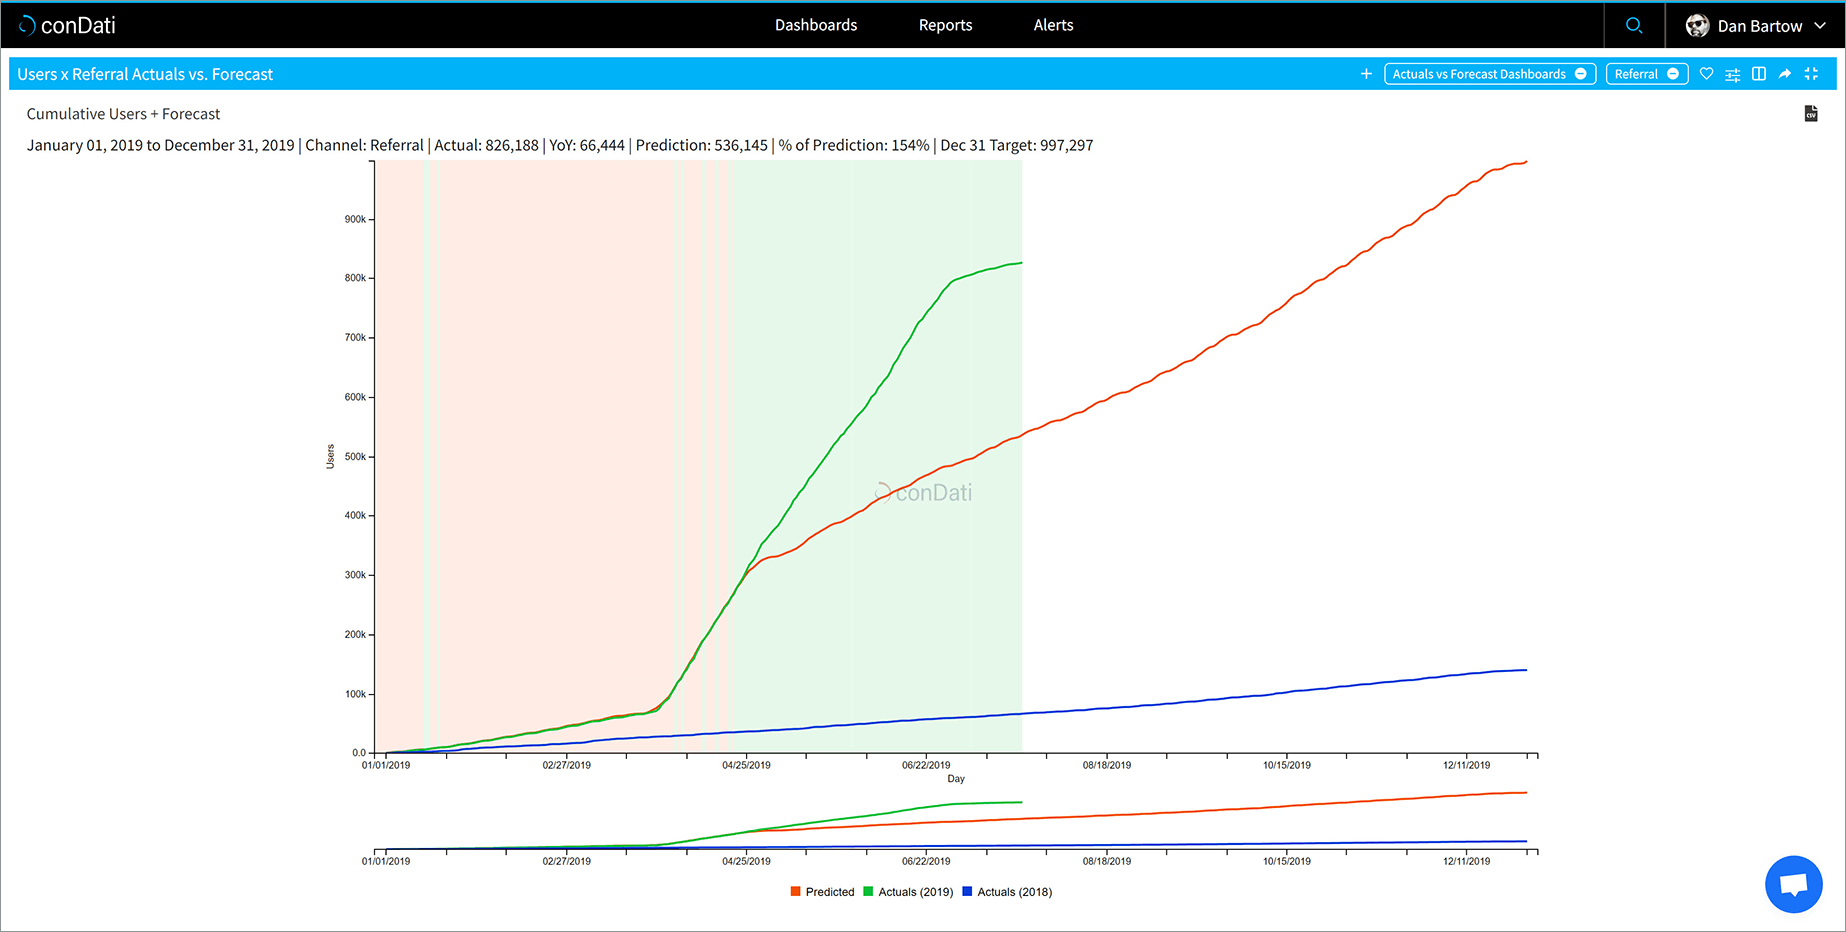
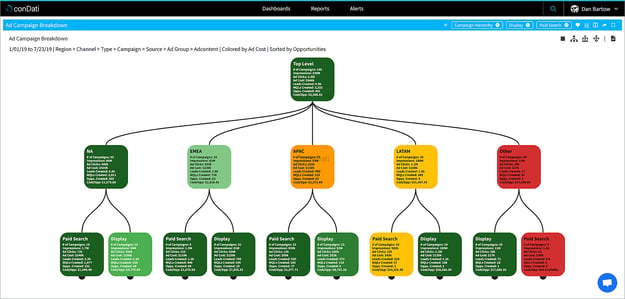
Forecasting for all marketing metrics—and beyond!
- Successful optimization, whether at the aggregate or granular level, is supported by highly accurate forecasting
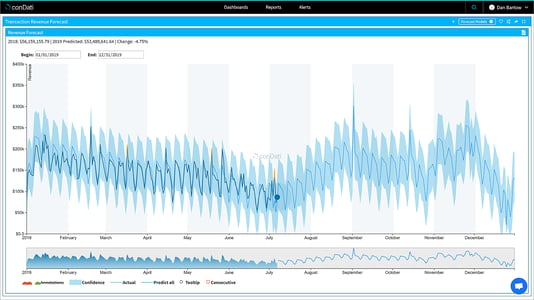
- Forecast valuable KPIs such as Revenue, Customers, Leads and Cost per Conversion from all data sources and channels
- Measure lift on campaign results against a forecast so you can adjust for the effects of seasonality in your performance and A/B testing

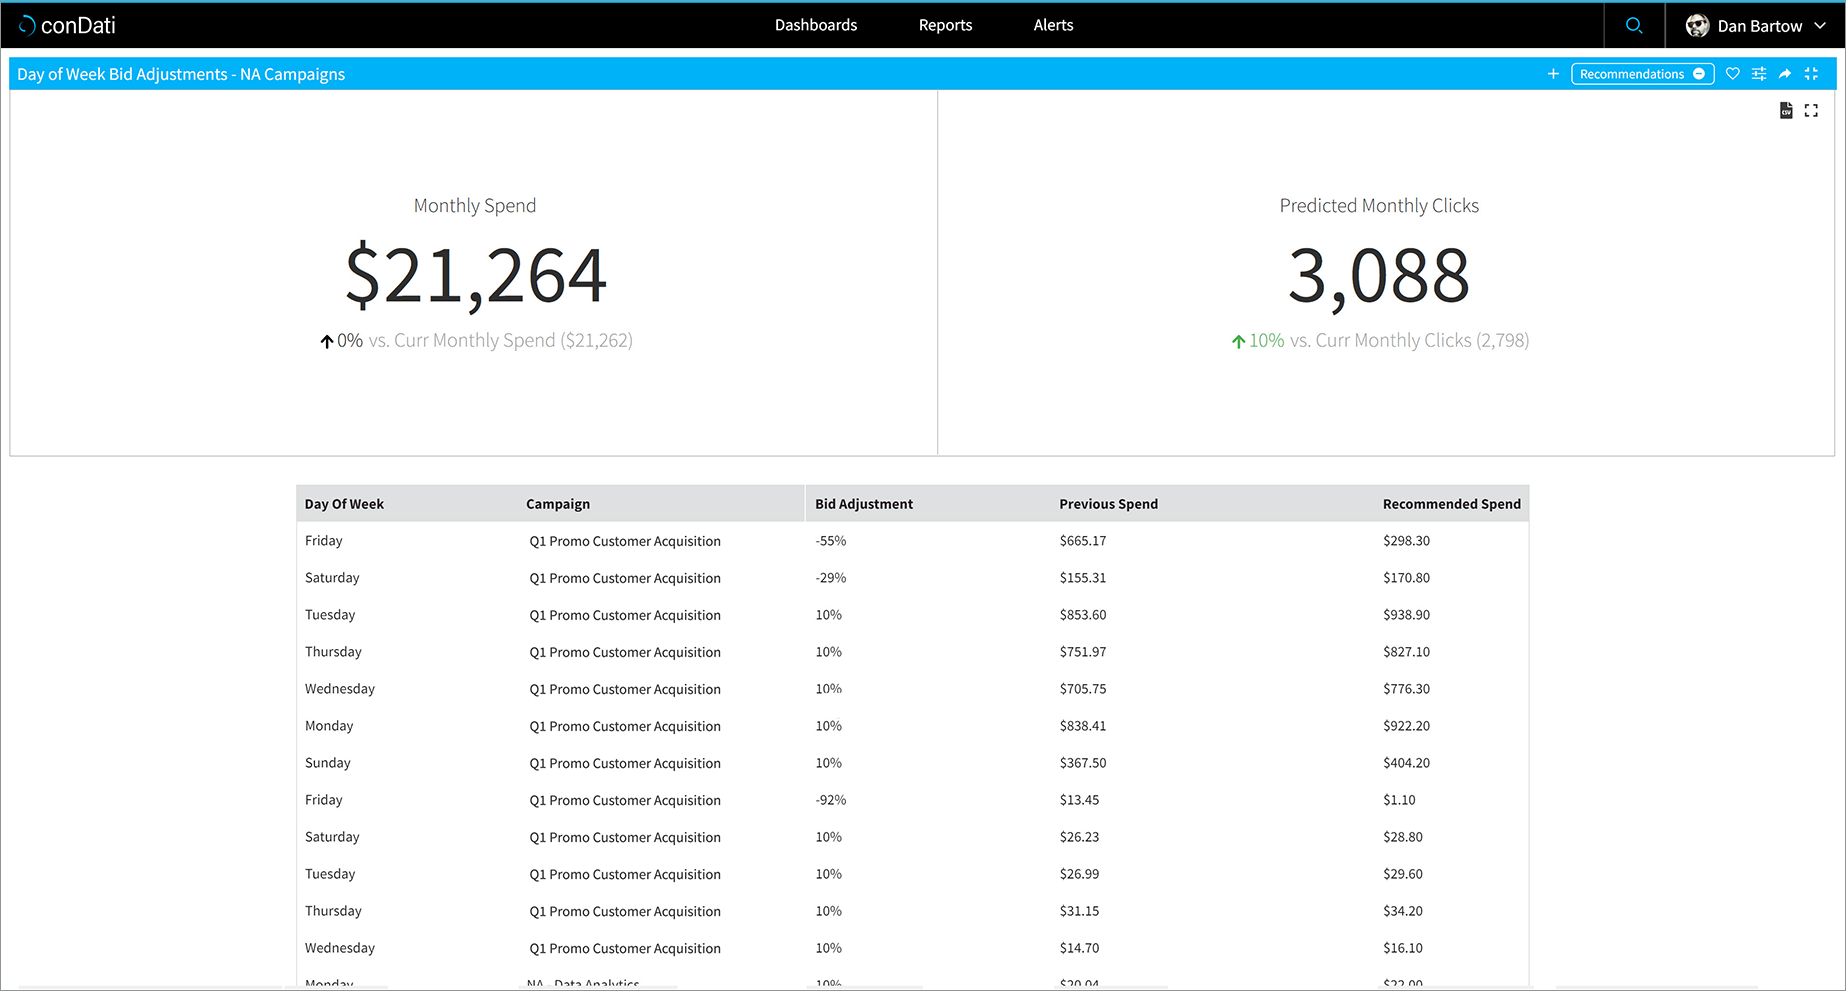
AI optimization and recommendations
- Our AI optimization engine looks at hundreds to thousands of ad targeting parameters to help optimize your spend
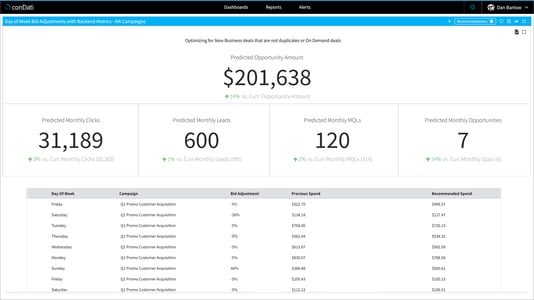
- Looks at every campaign and every targeting dimension—applying forecasting and optimization algorithms—to help you make informed budget allocation decisions
- Makes recommendations across any number of campaigns
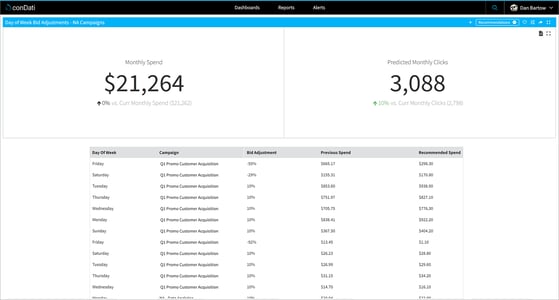
- Activates recommendations in ad platforms within minutes
- Easily compares performance across ad channels e.g. Google vs. Bing
- You’ll see significant, proven results in campaign lift

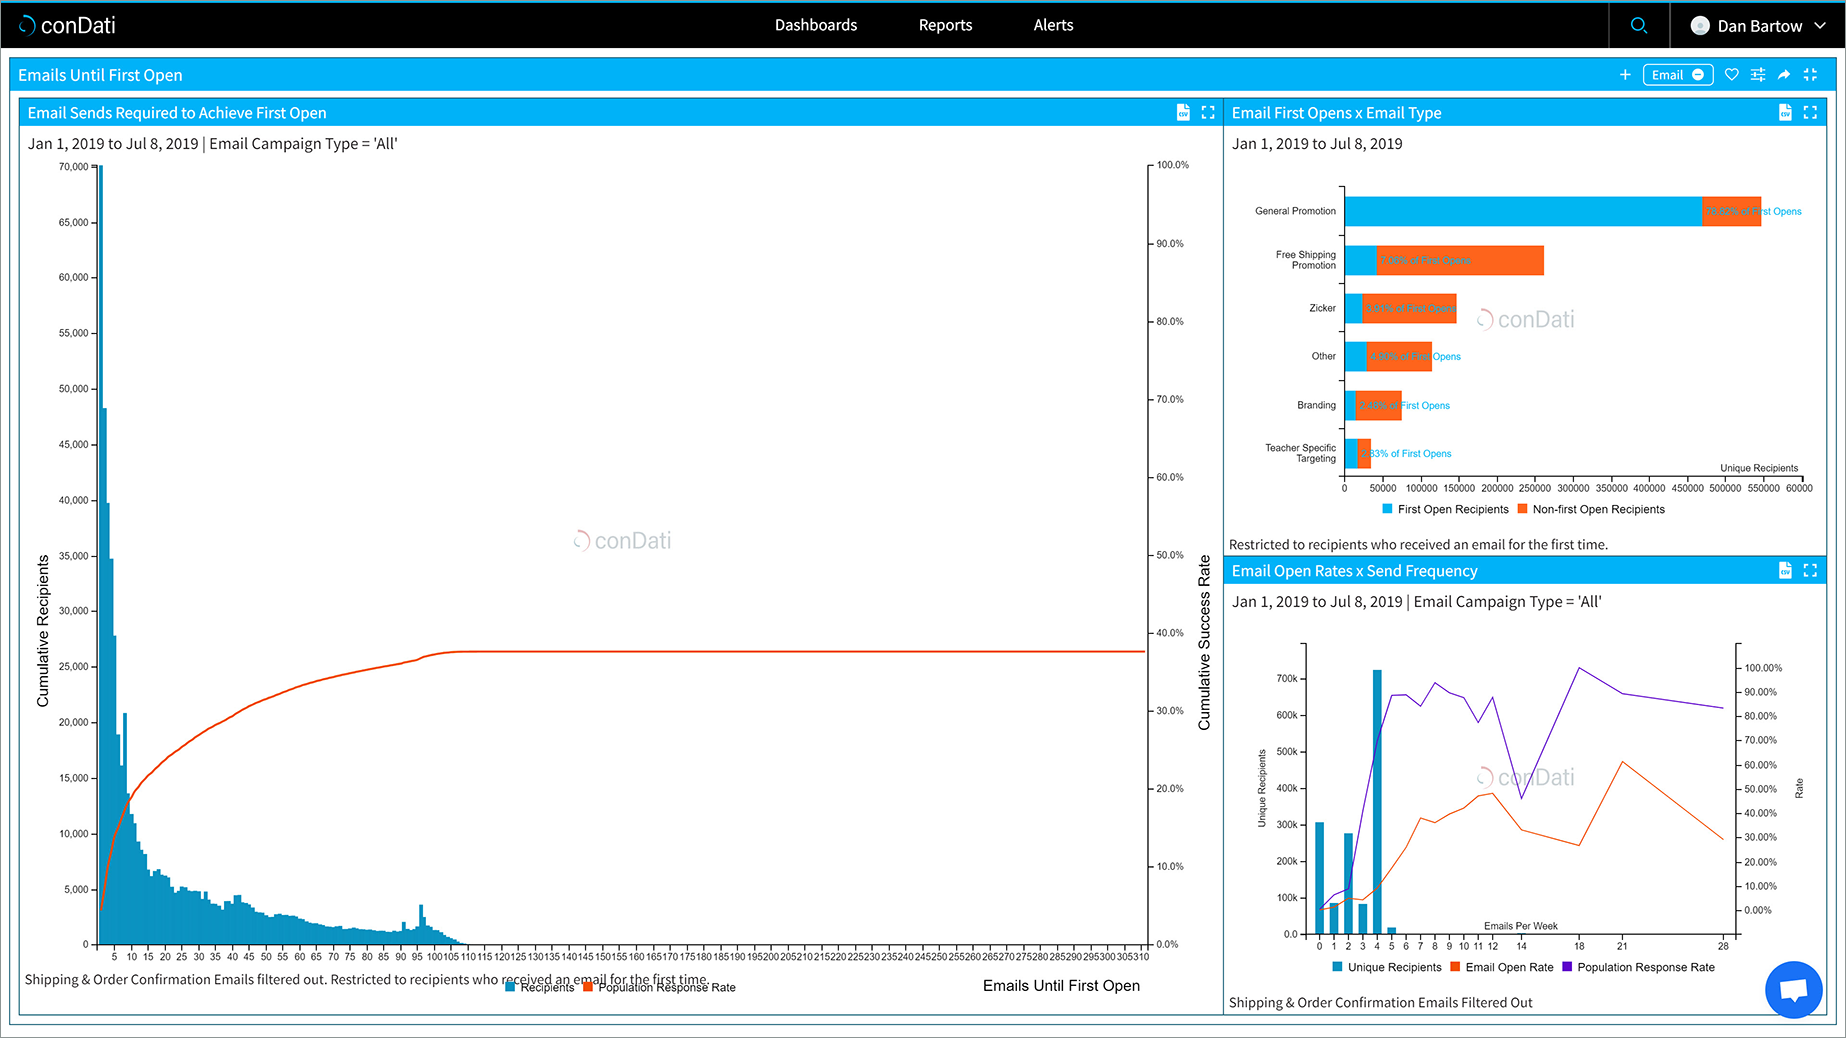
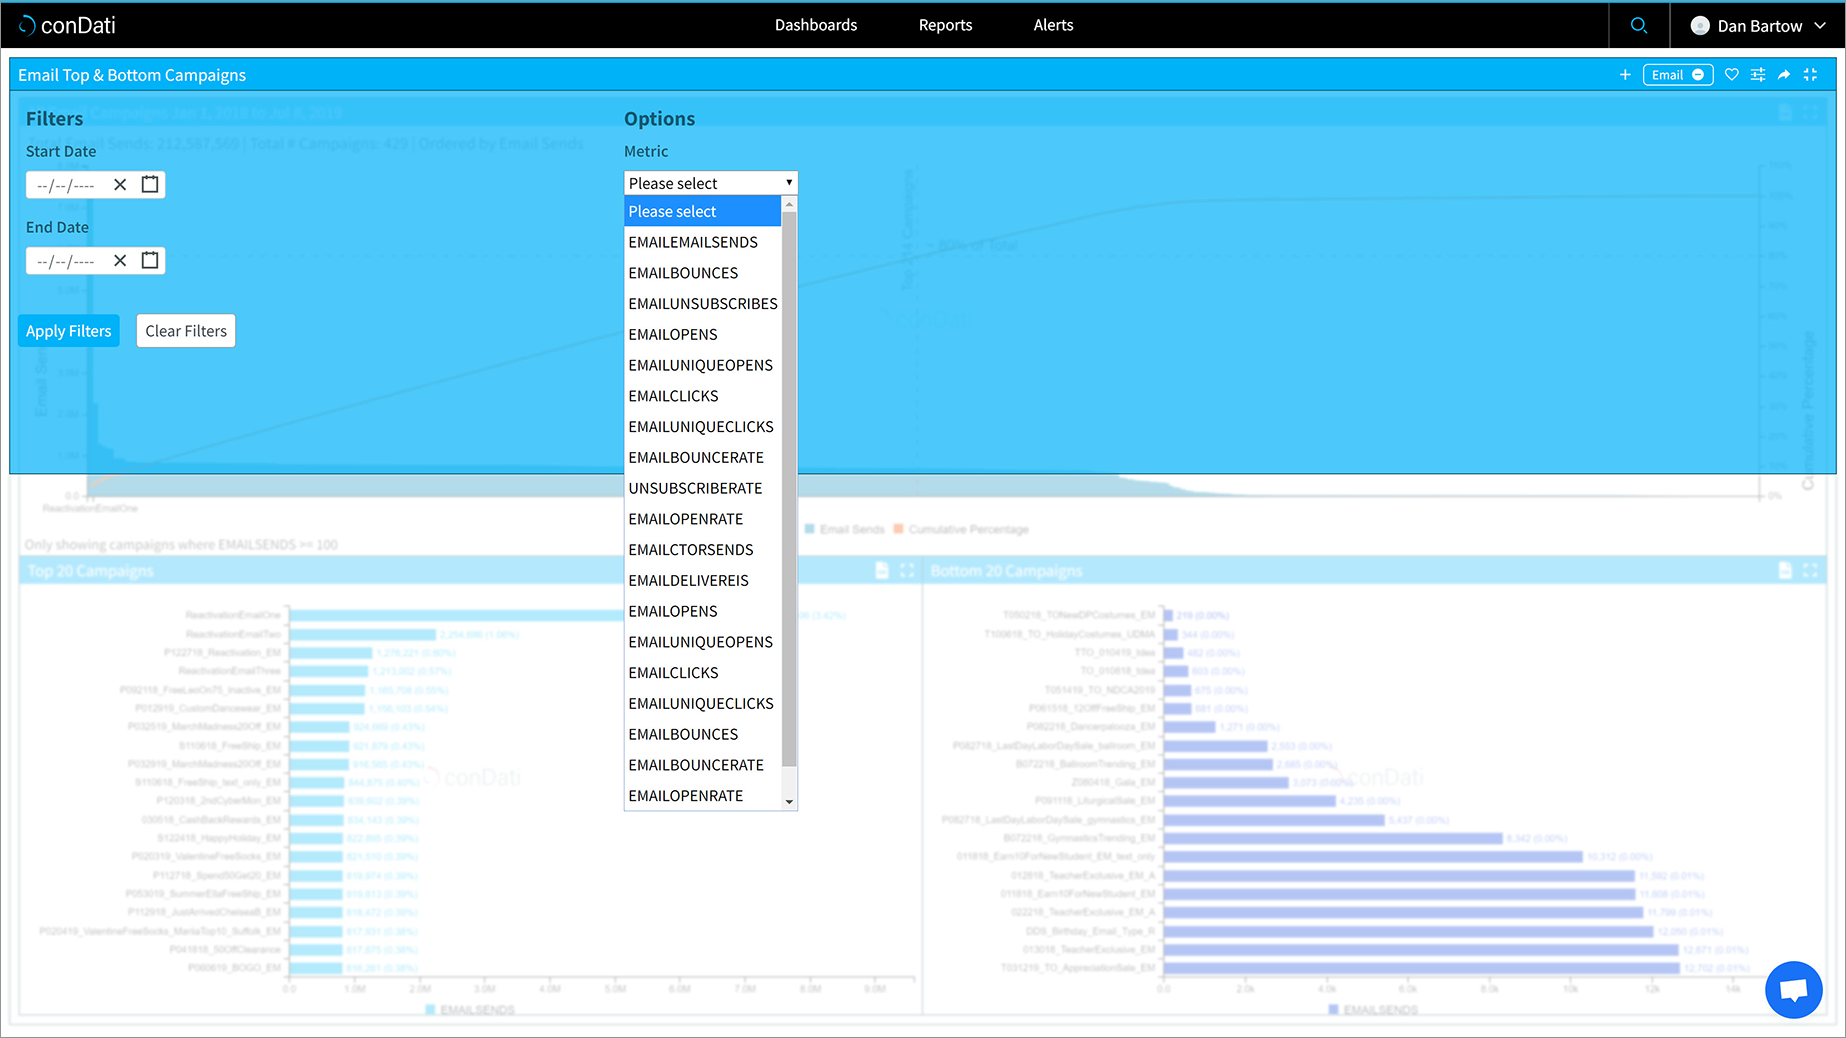
Email analytics
- Best in class analytics that use AI and ML to analyze and optimize your email effectiveness
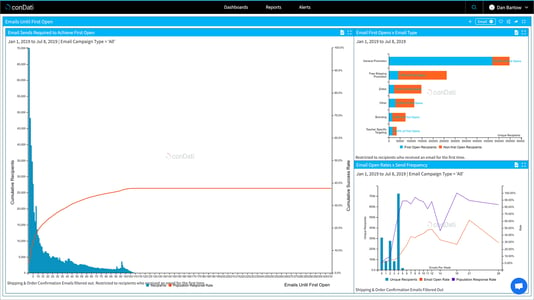
- This module offers interactive visualizations to quickly identify which campaigns are performing the best based on your business goals
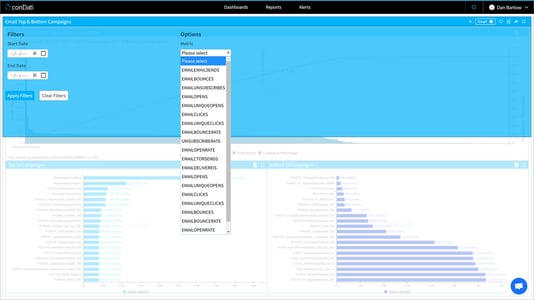
- Machine learning forecasting and AI optimization is applied to help optimize the best day/time to send, best subject lines and words to use, and more
Data Accessibility
Data export to CSV
- This is the most customer requested feature of 2019, which we are happy to deliver!
- The data behind the visualization of every widget in every dashboard can be exported as a CSV file
- CSV exports from campaign recommendations are formatted for direct import into ad-tech platforms such as Google and Facebook

API to fetch unified data for use outside the conDati platform
- The freedom to use your unified data asset outside of the conDati platform
- Programmatic access to conDati’s underlying data model through a REST API
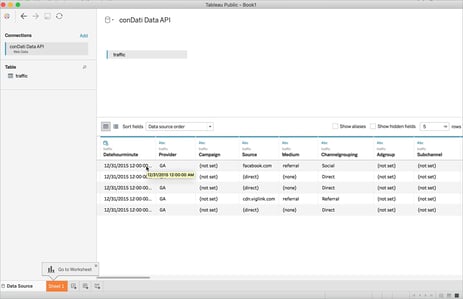
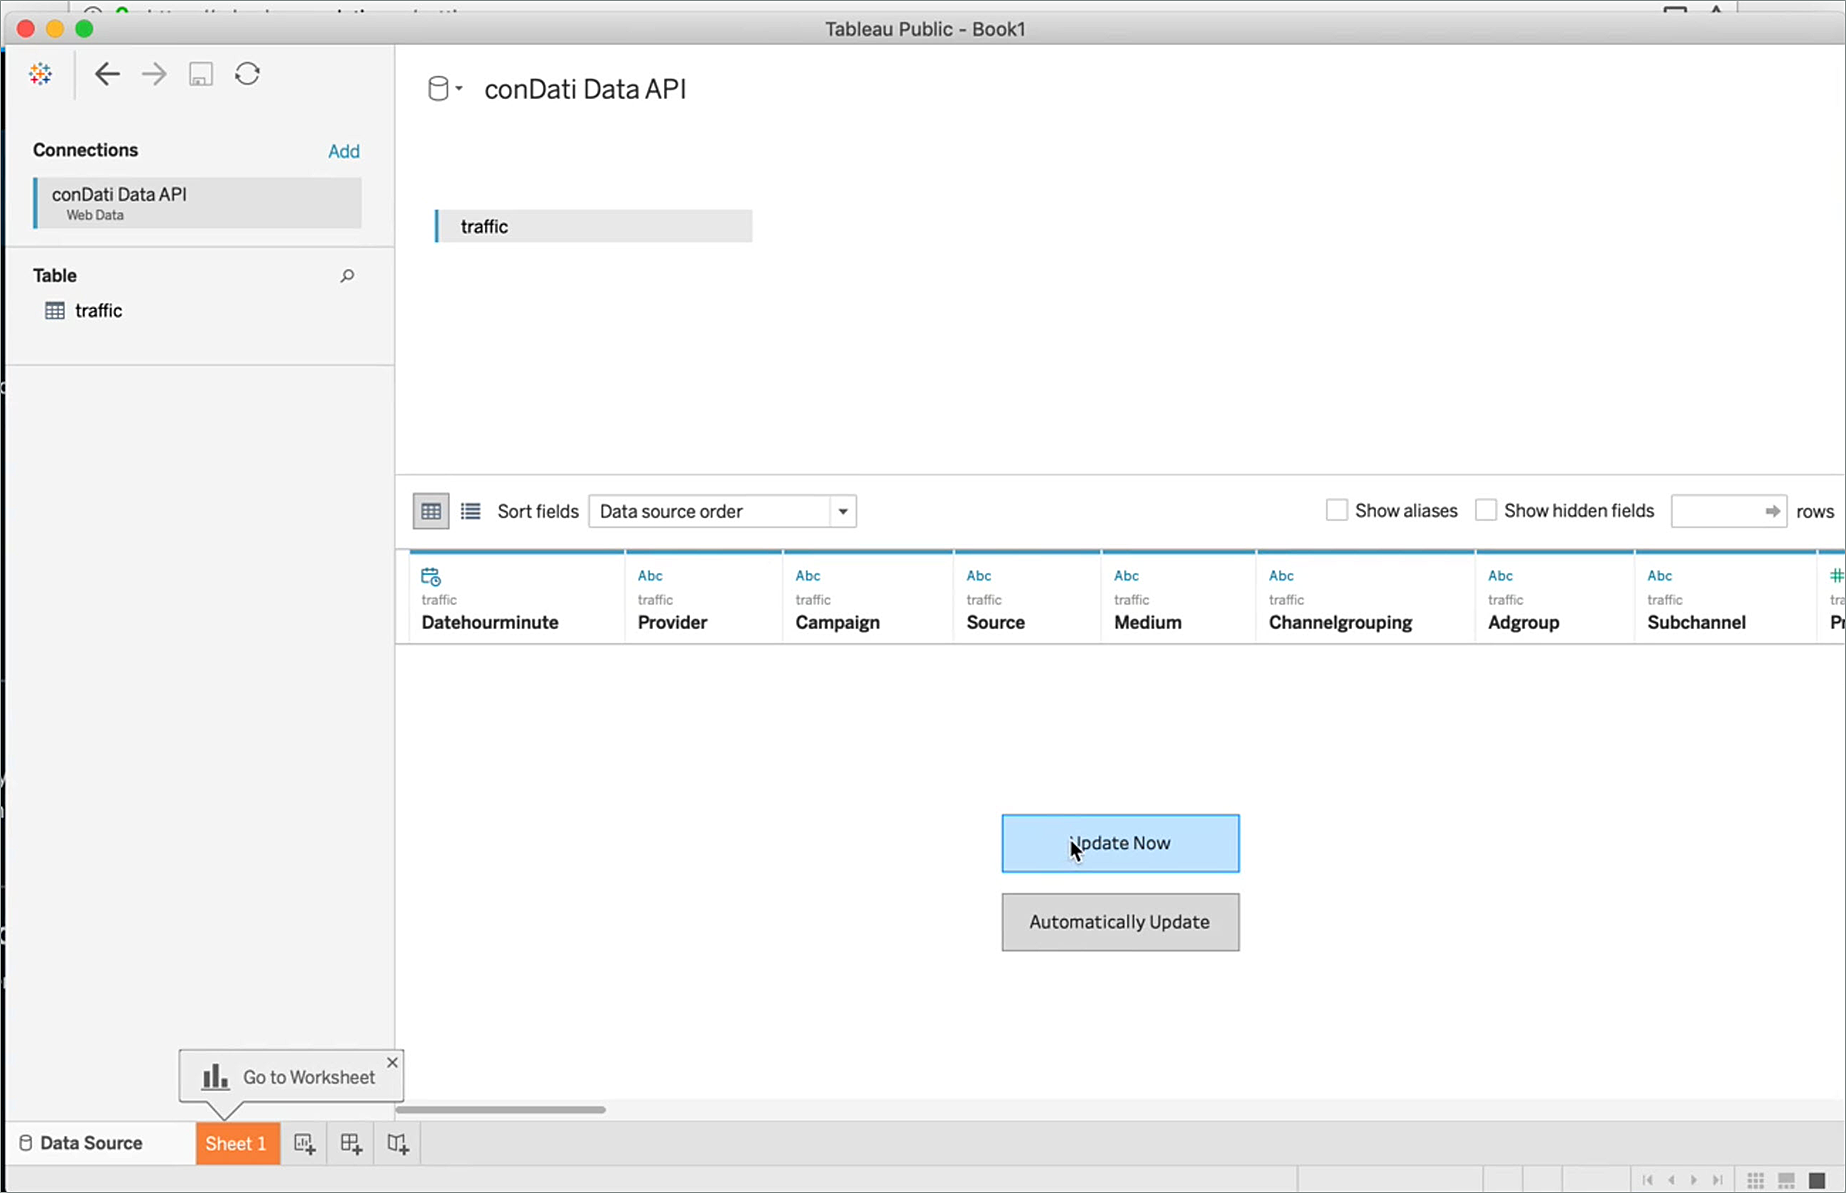
Tableau web connector
- This enables conDati customers to attach to your unified data asset for visualization in Tableau

- Our ‘web connector’ returns your unified data in a format that Tableau can parse

Customer-Focused Architecture
Change from platform re-architecture to queue-based system for data science processing
- Powerful and efficient parallel processing of data science code is in production behind our dashboards
- Load time reduced by 90 percent + for most dashboards
- Two-way asynchronous connection (WebSocket) open from the UI to the data science back end
Customer-driven enhancements to product navigation
Better looking, more familiar, and more efficient desktop navigation based on customer feedback, including:
- Top and side navigation menus that are common in MarTech tools
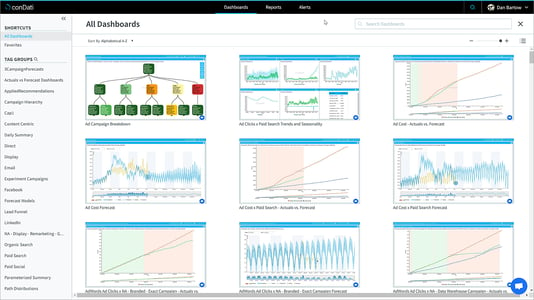
- List view sortable by name or by last viewed
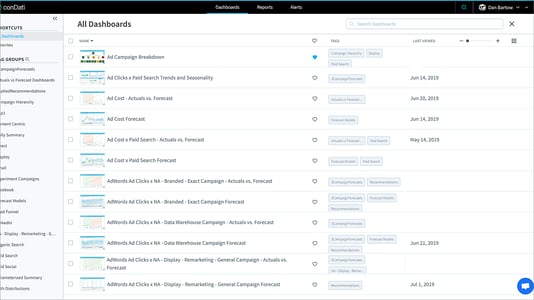
- Bulk dashboard grouping
- Smart search for dashboard tag groups or individual dashboards
- Adjustable thumbnail tile sizes
- And lots more

